
An analysis of the change in dwelling values across each of the capital city housing markets reveals that Sydney is the only city to have recorded higher levels of value growth this decade compared to last.
by Cameron Kusher (Corelogic)
The CoreLogic Home Value Index results show that between January 2000 and February 2007, combined capital city dwelling values increased by 98.2% compared to an increase of 44.9% over the period from January 2010 to February 2017. Dwelling value growth so far this decade has been less than half that over the same period last decade.
Combined capital city dwelling value change

While the combined capital city results reflect broad housing market performances, when the data is analysed across individual capital cities they highlight the diversity in housing market growth rates that lie underneath the more macro combined capital city results.
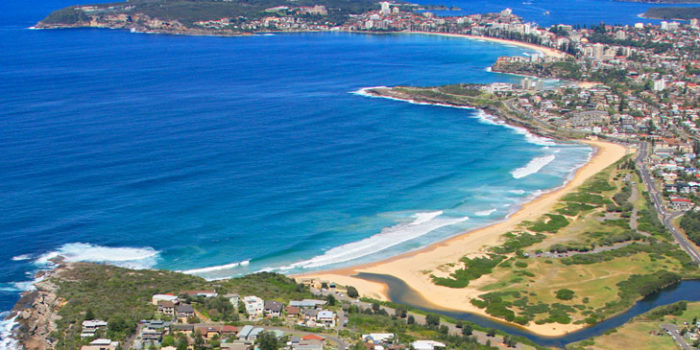
Between January 2000 and February 2007, Sydney dwelling values increased by 61.1% compared to 78.3% over the same period this decade. Early in the 2000’s values rose rapidly before starting to fall in 2004. By comparison, values fell early in this decade but have been trending higher since June 2012. Sydney is the only capital city that has recorded a greater increase in values so far this decade compared to the previous decade.
Melbourne dwelling values increased by 95.6% between January 2000 and February 2007 compared to an increase of 55.1% so far this decade.

Dwelling values across Brisbane have increased by just 6.6% since January 2010 compared to an increase of 147.2% between January 2000 and February 2007. While values consistently moved higher over the previous decade, there has been very little growth in values so far this decade.
Similar to Brisbane, growth in Adelaide dwelling values has been much softer this decade compared to last. Between January 2000 and February 2007, dwelling values rose 124.4% compared to an increase of 11.0% between January 2010 and February 2017.

Perth dwelling values have actually declined by -3.3% between January 2010 and February 2017, by comparison they increased 199.4% between January 2000 and February 2007. While Perth values consistently rose throughout the first 86 months of last decade, they have been declining since the end of 2014.
Between January 2000 and February 2007, Hobart dwelling values increased by 198.0% while over the same 86 months so far this decade, values are just 3.4% higher, Growth in the Hobart housing market slowed shortly after February 2007 and has only recently started to show signs of a sustained recovery.

Darwin dwelling values increased by 97.3% between January 2000 and February 2007 compared to a fall of -5.0% between January 2010 and February 2017. So far this decade growth has been sluggish with values having fallen since the middle of 2014, by comparison values trended higher throughout the previous decade.
In Canberra, dwelling values have increased by 23.8% between January 2010 and February 2017 compared to an increase of 133.4% between January 2000 and February 2007.

Sydney and Melbourne are the only two cities that have recorded dwelling value increases of more than 25% since the beginning of 2010. By comparison, the weakest growth in values between January 2000 and February 2017 was an increase of 61.1% in Sydney which is actually higher than the growth in all capital cities except for Sydney so far this decade.
The data further reinforces that concerns around over valuations in the housing market are largely contained within Sydney and Melbourne. For the other capital cities, the reality is that since the beginning of the decade there has been very little value growth.